Understanding and Finding the Causes of Forest and Land Fires
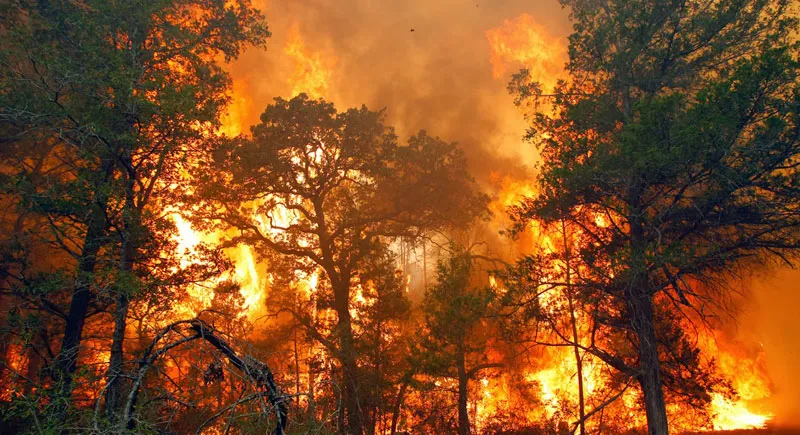
- Forest and land fires are not a phenomenon unique to Indonesia. The United States and the European Union also record millions of hectares of burned area, and the EU has just posted its worst season on record in 2025.
- In Indonesia, the most damaging fire emerges when three conditions coincide: El Niño, drained peatland, and the use of fire to open land.
- The location that burned does not automatically reveal who lit it. Fair attribution requires tracking the first fire point and its spread pathways.
- Scientific evidence also shows that fire in concession areas contributes meaningful emissions, so the plantation sector has to be part of the solution: prevention, data transparency, and compliance.
- The root of the problem often lies in land governance and land-tenure certainty, not in any single commodity.
The 2026 dry season is testing our readiness once again. BMKG states that El Niño 2026 is already active and has the potential to reach a very strong level[1]. As of 4 September 2026, high-confidence hotspots stood at 23,919 points[2], and by mid-July the cumulative total was rising faster than in previous El Niño years (2015, 2019, 2023)[3]. The Ministry of Forestry recorded 107,465 hectares of forest and land burned in January–June 2026[4]. The January–July figure already exceeded the same period in 2023 and 2019, but remains far below the roughly 600,000 hectares burned in the first seven months of 2015[5].
Every time fires grow, the public looks for a single answer: who set it? The question is fair, but landscape fire science teaches that fire emerges from the interaction of three factors: weather, fuel, and the ignition source. This article examines three questions:
- Is forest and land fire a phenomenon unique to Indonesia?
- What factors make fire so consequential in Indonesia, and how has the pattern shifted over the years?
- How should oil palm plantations be positioned fairly on the fire map: as victims, as locations, or as sources, and how can that be demonstrated?
Table of Contents
SECTION 01
Fire Is a Global Phenomenon, Not Unique to One Country
Before pointing to local causes, it is worth looking at the global scale. The table below compares burned area in Indonesia, the United States, and the European Union across the two most recent years for which complete data are available.
Scroll the table sideways if not all columns are visible.
| Year | Indonesia (SiPongi) | United States (NIFC) | European Union (EFFIS) |
|---|---|---|---|
| 2024 | 376,805 | ± 3.61 million | 383,317 |
| 2025 | ± 359,619 | ± 2.08 million | 1,079,538 |
In 2023, the burned area in Indonesia (around 1.16 million hectares)[7] and in the United States (2,693,910 acres, equivalent to about 1.09 million hectares)[6] were even of the same order of magnitude. In 2025, the European Union recorded its worst wildfire year since EFFIS record-keeping began, surpassing the 2017 record of 988,524 hectares[11].
Three Readings of This Data
- Not specific to Indonesia. Countries with advanced monitoring and suppression systems also experience years with millions of hectares burned.
- Not specific to an ecosystem or a commodity. Large fires occur across non-tropical ecosystems and other lands with no connection to oil palm plantations.
- This comparison is indicative, not equivalent. Definitions of “forest and land”, mapping methods, and dominant causes differ between countries. Indonesia’s distinctive feature, namely fire smouldering in peatland, produces smoke and emission impacts that are not captured by hectare figures alone.
SECTION 02
Why Fire Has a Distinctly Indonesian Impact: El Niño, Peatland, and Land-Clearing Fire
Scientific literature points to the convergence of several factors. First, climate. The 2015 fire season was recorded as the most severe since NASA satellites began observing in the early 2000s. Rainfall analysis shows that fire in Indonesia responds non-linearly to drought: the longer the number of days with rainfall below roughly 4 mm per day, the sharper the surge in fire, especially where fire is used to open and prepare degraded peatland[12]. Once fire penetrates the peat layer, it can smoulder beneath the surface until rain returns, making it difficult to extinguish by conventional means[13].
Second, peatland conditions. Page and Hooijer examine the relationship between deforestation, drainage, and accelerated carbon emissions from peat mineralisation and burning in Southeast Asia[14]. Around 68% of the world’s tropical peatland lies in this region[15], so peatland hydrology directly influences fire risk.
Third, drought is not the only factor. A study of the 2013 Sumatra fires showed large peat fire emissions even in a year without extreme drought[16].
National Pattern
| Year | Forest and Land Fire Area (hectares) |
|---|---|
| 2015 | 2,611,411 |
| 2016 | 438,363 |
| 2017 | 165,484 |
| 2019 | 1,649,258 |
| 2020 | 296,942 |
| 2023 | 1,161,193 |
| 2024 | 376,805 |
| 2025 | ± 359,619 |
The pattern rises and falls with El Niño years, but the peaks are declining: 2.61 million hectares (2015), 1.65 million (2019), then 1.16 million (2023). This decline in peak years deserves recording as an indication that control is improving, although the contribution of each factor (rainfall, peatland restoration, law enforcement, weather modification) needs to be assessed separately. The 2026 fire season is the next test.
The data also needs to be read with care. Greenpeace Indonesia estimates the indicative 2023 fire area at no less than 2.13 million hectares, nearly double the SiPongi figure of 1.16 million, and found that around 1.3 million hectares of it had burned at some point between 2015 and 2022[17][18]. The difference in mapping methods matters: without an agreed baseline, it is hard to judge whether policy is genuinely working. The finding that burned areas repeat also indicates that the same land stays vulnerable after the first fire, making water management and land cover recovery as important as suppression.
SECTION 03
Palm Oil in the Fire Map: Victim, Location, or Source?
This question is most often simplified. The available evidence supports a more layered reading.
Where a fire burned is not necessarily where it started. Satellite imagery and hotspots show where fire is detected, not who lit it. In the dry season, wind can carry fire from surrounding land, including through the peat layer beneath the surface[13]. RSPO monitoring of its members’ concessions as of 27 October 2026 shows both directions of spread: 382 confirmed fire points (2,090 hectares) inside concessions, 100 points (687 hectares) that originated outside and spread inward, and 520 points (6,422 hectares) outside concessions[19]. This data covers RSPO members only, not the whole palm oil sector. Sawit Watch itself argues that concessions of certification-scheme members should never burn[19], a claim that deserves an answer backed by transparent prevention data.
The picture varies by province. In Jambi, fires were recorded in oil palm concessions belonging to 36 corporations covering roughly 4,000 hectares, out of 42,455 hectares identified in the province[20].
Law enforcement works case by case. The Ministry of Forestry imposed administrative sanctions on 32 companies covering a total burned area of 12,926.74 hectares across seven provinces[21], and named two corporations as suspects[22]. A process like this underscores that wrongdoing must be proven case by case, not attributed to a commodity or to an entire industry.
Spatial evidence demands that the sector take responsibility for prevention. Marlier and colleagues mapped fire emissions in the 2006 season: fire in industrial plantation forest concessions in Sumatra and in oil palm concessions in Kalimantan contributed the largest share of concession-related emissions on their respective islands[23]. Overall, fire linked to industrial concessions accounted for almost half of fire emissions on both islands[24], and caused roughly one-third of the smoke exposure of Asia’s populations during the 1997–98 haze crisis[25]. These findings are spatial (showing where fire was, not proving who lit it) and use 2006 season data. Even so, they are strong enough to explain why prevention in concessions, especially on peatland and degraded land, becomes a policy priority.
The losses from fire are broad. The World Bank estimates the 2015 fire crisis (2.6 million hectares) cost USD 16.1 billion[26]. Minister of Forestry Raja Juli Antoni noted that the 2015 impacts covered airport operations, trade, schools, and health services[27]. Losses at the individual plantation level have not yet been systematically documented in the literature cited here, leaving room for business, government, and academia to build shared data.
SECTION 04
The Economics of Fire and Land Governance
Why is fire used? A political economy study by CIFOR, Universitas Riau, and IPB in four regencies of Riau found a range of actors who benefit from fire; farmer group organisers gain up to USD 486 per hectare[26]. Land opened with fire sells for more, around USD 856 per hectare compared with USD 665 for land opened without burning, because it is ready to plant[28]. This practice spreads in open-access areas, abandoned former concessions, and land with unclear claims[28]. The implication is that fire is not only about individual negligence or intent, but also about incentives in the informal land market.
The framework most often used is tragedy of the commons: open-access resources tend to degrade because no party bears the cost of preserving them[29]. Elinor Ostrom showed that communities with clear rules, monitoring, and sanctions can manage shared resources sustainably[30], so what determines outcomes is clarity of rights and enforcement, not ownership status alone. Accordingly, certainty of land status and boundaries, oversight of open-access areas, and incentives for farmers to open land without burning become part of prevention, in line with the recommendations of the Riau study[28].
SECTION 05
The Legal Framework Already Exists
Law No. 32 of 2009 prohibits opening land by burning, with limited exceptions for local wisdom[31]. Law No. 39 of 2014 prohibits plantation businesses from opening or cultivating land by burning[32]. Government Regulation No. 57 of 2016 governs the protection and management of peatland ecosystems[33], and Presidential Regulation No. 1 of 2016 established the Peatland Restoration Agency, which was later revoked and superseded by Presidential Regulation No. 120 of 2020 on the Peatland and Mangrove Restoration Agency[34]. The key question now is consistency of implementation and the quality of evidence in the field.
SECTION 06
An Evidence-Based Agenda
- Rainfall-based early warning. Rainfall thresholds correlate with fire surges across all the satellite data analysed, so they can serve as an early-action trigger[12][13]. BMKG, together with ministries and local governments, is expanding weather modification operations as a preventive step[35].
- Water management and peatland restoration. Because drainage and deforestation accelerate peatland vulnerability[14], rewetting becomes the key to long-term prevention. Tacconi (2016) emphasises that Indonesia’s peatland must be protected and restored to prevent fires and their health, environmental, and economic impacts[36].
- Zero-burning land development and incentives for farmers. The Riau study emphasises economic incentives and disincentives, along with law enforcement against illegal land claims[26][28].
- Evidence-based attribution. Trace the first fire point and its spread pathways, using satellite imagery from several days or hours earlier where available, before drawing conclusions about cause.
- Data transparency. Reporting fire points inside and outside concessions, as RSPO does for its members[19], can be extended and opened up for public verification.
- Cross-party data collaboration. The gap in estimates between government and civil society organisations[17] shows the need for an agreed mapping methodology.
SECTION 07
Conclusion
Forest and land fire is a multi-factor phenomenon. Extreme weather, peatland hydrology, land market incentives, and human activity operate together, and no single explanation is sufficient. Cross-country data show that large fires are neither unique to Indonesia nor to one commodity, while national data show that control can improve year on year.
At the same time, spatial evidence shows that fire in concession areas does contribute to emissions and smoke. The most defensible position for the palm oil industry is therefore an evidence-based one: demanding fair attribution (a burned location is not the same as a perpetrator) while strengthening prevention, data openness, and field-level compliance.
El Niño 2026 is not over. The lesson of 2015 is simple: fire is easier to prevent than to extinguish, and prevention works best when data, land governance, and collaboration move together.
SECTION 08
References
All links accessed on 5 November 2026.
- BMKG. (2026, 29 July). BMKG strengthens preparedness for El Nino 2026 impact, focuses on securing water availability and preventing forest and land fires. https:/
/ www. bmkg. go. id/ berita/ utama/ bmkg- perkuat- antisipasi- dampak- el- nino- 2026- fokus- jaga- ketersediaan- air- dan- cegah- karhutla - BMKG. (2026, 7 September). El Niño impact still warrants vigilance; BMKG strengthens support for forest and land fire control. https:/
/ www. bmkg. go. id/ berita/ utama/ dampak- el- nino- masih- perlu- diwaspadai- bmkg- perkuat- dukungan- pengendalian- karhutla - Sari, L. D. (2026, 31 July). BMKG records 5,019 forest and land fire hotspots, with peak risk in August–September. Metro TV News. https:/
/ www. metrotvnews. com/ read/ NA0CrW9j- bmkg- catat- 5- 019- titik- panas- karhutla- puncak- risiko- agustus- september - iNews.id. (2026, 19 July). Forest and land fire in Indonesia reaches 107,465 hectares, with West Kalimantan the most affected (Ministry of Forestry data). https:/
/ www. rctiplus. com/ news/ detail/ terkini/ 5431931/ karhutla- di- indonesia- capai- 107- 465- hektare- – kalbar- paling- luas- terdampak - Ayuningtyas, A. D. (2026, 18 August). 2026 forest and land fire larger than 2023 and 2019, with the strongest El Niño looming. Katadata. https:/
/ katadata. co. id/ ekonomi- hijau/ ekonomi- sirkular/ 6a8470c75e6ce/ karhutla- 2026- lebih- luas- dari- 2023- dan- 2019- el- nino- terkuat- mengintai - National Interagency Coordination Center. Total wildland fires and acres (1983–2025). National Interagency Fire Center. (conversion: 1 acre = 0.4047 hectares)
- Goodstats. Indonesian forest and land fire area 2015–2024 (SiPongi data). https:/
/ data. goodstats. id/ statistic/ simak- luas- karhutla- indonesia- 2015- 2024- ggvhd - Jawa Pos. Preventing forest and land fire: government urged to prioritise prevention and legal certainty (SiPongi, Ministry of Forestry data, includes 2025 figures). https:/
/ www. jawapos. com/ nasional/ 2610260097/ cegah- karhutla- pemerintah- didorong- kedepankan- pencegahan- dan- kepastian- hukum - European Commission, Joint Research Centre / EFFIS. (2026, 31 March). 2025 was EU’s most destructive wildfire season on record. ; summary figures: UNDRR PreventionWeb, https:/
/ joint- research- centre. ec. europa. eu/ jrc- news- and- updates/ 2025- was- eus- most- destructive- wildfire- season- record- 2026- 03- 31_ en; summary figures: UNDRR PreventionWeb, https:/ / www. preventionweb. net/ quick/ 101873 - Anadolu Agency. (2026, 7 February). EU forests suffer largest loss on record in 2025 wildfires (EFFIS data, includes 2024 figures). https:/
/ www. aa. com. tr/ en/ greenline/ climate- change/ eu- forests- suffer- largest- loss- on- record- in- 2025- wildfires/ 1829093 - RTE. (2025, 21 August). Record EU wildfires burnt more than 1mn hectares in 2025, data shows. https:/
/ www. rte. ie/ news/ europe/ 2025/ 0821/ 1529550- wildfires- europe- data - Field, R. D., van der Werf, G. R., Fanin, T., et al. (2016). Indonesian fire activity and smoke pollution in 2015 show persistent nonlinear sensitivity to El Niño-induced drought. Proceedings of the National Academy of Sciences, 113(33), 9204–9209. https:/
/ doi. org/ 10. 1073/ pnas. 1524888113 - NASA Science. El Niño a key player in severe Indonesia fires. https:/
/ science. nasa. gov/ earth/ natural- disasters/ wildfires/ el- nino- a- key- player- in- severe- indonesia- fires/ - Page, S. E., & Hooijer, A. (2016). In the line of fire: the peatlands of Southeast Asia. Philosophical Transactions of the Royal Society B, 371(1696), 20150176. https:/
/ doi. org/ 10. 1098/ rstb. 2015. 0176 - ASEAN Secretariat & IFAD. (2019). Measurable Action for Haze-Free Sustainable Land Management in Southeast Asia (MAHFSA) Programme (flyer, citing Page & Hooijer, 2016). https:/
/ asean. org/ wp- content/ uploads/ 2021/ 01/ MAHFSA- Flyer. pdf - Gaveau, D. L. A., et al. (2014). Major atmospheric emissions from peat fires in Southeast Asia during non-drought years: evidence from the 2013 Sumatran fires. Scientific Reports, 4, 6112. https:/
/ doi. org/ 10. 1038/ srep06112 - Greenpeace Indonesia. (2024, August). Fire in the ashes: chronic 2023 forest and land fire data. https:/
/ www. greenpeace. org/ indonesia/ laporan/ 59567/ karhutla- kronis/ - Pristiandaru, D. L. (2024, 17 October). Greenpeace questions the data on the decline in forest and land fire in 2023. Kompas.com. https:/
/ lestari. kompas. com/ read/ 2024/ 10/ 17/ 130000486/ greenpeace- pertanyakan- data- penurunan- karhutla- tahun- 2023 - Ayuningtyas, A. D. (2026, 31 October). Thousands of hectares of orangutan habitat burned, partly in RSPO oil palm concessions (includes RSPO monitoring data as of 27 October 2026 and Sawit Watch statements). Katadata. https:/
/ katadata. co. id/ finansial/ makro/ 6ae554bd4da7a/ ribuan- hektare- habitat- orangutan- terbakar- sebagian- di- konsesi- sawit- rspo - Kompas.com. (2026, 10 October). Forest and land fire in Jambi passes 42,455 hectares, with peatland and conservation areas under threat. https:/
/ regional. kompas. com/ read/ 2026/ 10/ 10/ 140054778/ karhutla- di- jambi- tembus- 42455- hektare- gambut- dan- kawasan- konservasi - ANTARA. (2026, 19 October). Ministry of Forestry sanctions 32 companies linked to forest and land fire. https:/
/ www. antaranews. com/ berita/ 5796597/ kemenhut- beri- sanksi- 32- perusahaan- terkait- karhutla - Harian Jogja / Newswire. (2026, 30 October). Ministry of Forestry names 2 corporations suspects in forest and land fire. https:/
/ news. harianjogja. com/ r- 1277035/ kemenhut- tetapkan- 2- korporasi- tersangka- karhutla- ada- pma- singapura - Marlier, M. E., et al. (2015). Fire emissions and regional air quality impacts from fires in oil palm, timber, and logging concessions in Indonesia. Environmental Research Letters, 10(8), 085005. https:/
/ doi. org/ 10. 1088/ 1748- 9326/ 10/ 8/ 085005 - IOP Publishing. (2015, 12 August). Could controlling fire emissions in industrial plantations be key to improving air quality in Equatorial Asia? ScienceDaily. https:/
/ sciencedaily. com/ releases/ 2015/ 08/ 150811215651. htm - Spracklen, D. V., Reddington, C. L., & Gaveau, D. L. A. (2015). Industrial concessions, fires and air pollution in Equatorial Asia. Environmental Research Letters, 10(9), 091001. https:/
/ doi. org/ 10. 1088/ 1748- 9326/ 10/ 9/ 091001 - Purnomo, H., Shantiko, B., Sitorus, S., Gunawan, H., Achdiawan, R., Kartodihardjo, H., & Dewayani, A. A. (2017). Fire economy and actor network of forest and land fires in Indonesia. Forest Policy and Economics, 78, 21–31. (includes World Bank estimate for 2015: USD 16.1 billion)
- JPNN. Beware of this year’s forest and land fire cases; Minister of Forestry highlights the El Nino Godzilla phenomenon. https:/
/ www. jpnn. com/ news/ waspada- kasus- karhutla- tahun- ini- menhut- ungkit- fenomena- el- nino- godzilla - Mongabay. (2017, January). How local elites earn money from burning land in Indonesia (review of Purnomo et al., 2017). https:/
/ news. mongabay. com/ 2017/ 01/ how- local- elites- earn- money- from- burning- land- in- indonesia/ - Hardin, G. (1968). The tragedy of the commons. Science, 162(3859), 1243–1248. https:/
/ doi. org/ 10. 1126/ science. 162. 3859. 1243 - Ostrom, E. (1990). Governing the Commons: The Evolution of Institutions for Collective Action. Cambridge University Press.
- Law of the Republic of Indonesia No. 32 of 2009 on Environmental Protection and Management, Article 69.
- Law of the Republic of Indonesia No. 39 of 2014 on Plantations, Article 56.
- Government Regulation No. 57 of 2016 amending Government Regulation No. 71 of 2014 on the Protection and Management of Peatland Ecosystems.
- Presidential Regulation No. 1 of 2016 on the Peatland Restoration Agency (revoked by Presidential Regulation No. 120 of 2020 on the Peatland and Mangrove Restoration Agency, https://peraturan.bpk.go.id/Details/161452/perpres-no-120-tahun-2020).
- IDX Channel. (2026, 31 July). BMKG expands weather modification operations in anticipation of El Nino into early 2027. https:/
/ www. idxchannel. com/ news/ bmkg- perluas- operasi- modifikasi- cuaca- demi- antisipasi- el- nino- hingga- awal- 2027/ 2 - Tacconi, L. (2016). Preventing fires and haze in Southeast Asia. Nature Climate Change, 6, 640–643. https:/
/ doi. org/ 10. 1038/ nclimate3008